Stock Chart of the Day S and P 500 P/E
- Nov 5, 2018
- 1 min read
As we can see below the Spx on a trailing P/E basis is nearly as expensive as the 2000 Bubble.
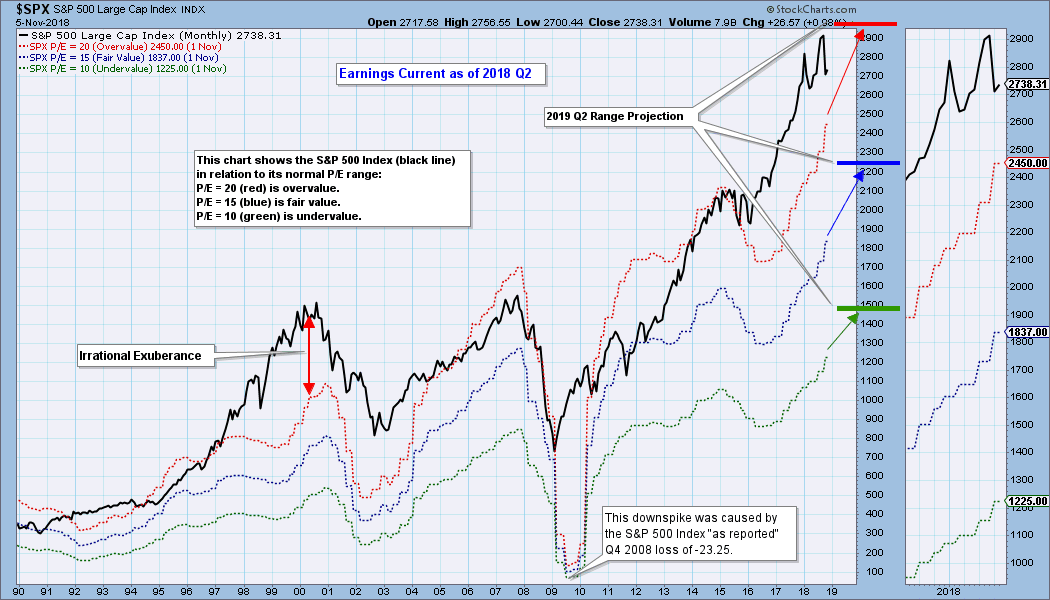

As we can see below the Spx on a trailing P/E basis is nearly as expensive as the 2000 Bubble.